📈 USD/JPY Retreats from 164.50 as Fractal Resistance Holds
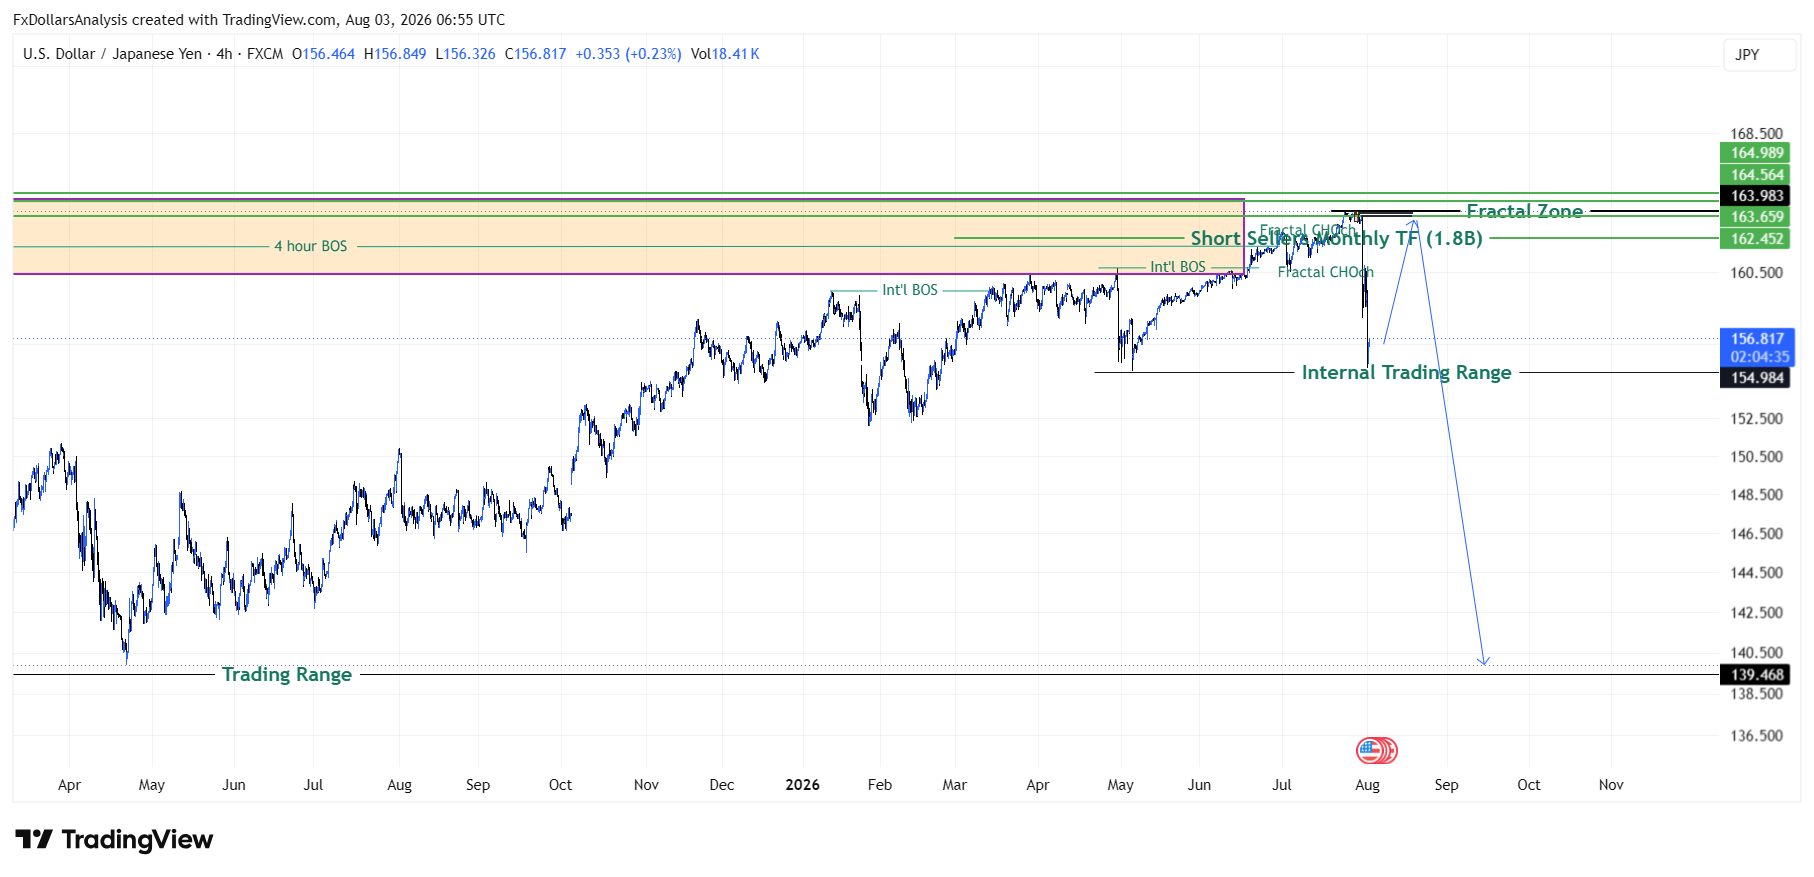
USD/JPY slipped from multi‑month highs near 164.50 after testing a dense fractal resistance zone. Volume divergence and repeated Break of Structure (BOS) signals suggest momentum exhaustion. Traders now eye a corrective move toward 140.00 if bearish confirmation unfolds below 156.00.

🧩 Market Context
The pair has been in a sustained uptrend since early 2025, but recent price action highlights distribution behavior at the top. The Fractal Zone (160.5–163.98) has capped upside, with institutional liquidity clustering around prior swing highs.
🔍 Key Technical Levels
| Zone / Level | Description | Implication |
|---|---|---|
| 162.45–164.98 | Fractal Zone & Monthly TF | High‑probability reversal area |
| 156.81–154.98 | Internal Trading Range | Mid‑range liquidity pool |
| 139.46–140.50 | Long‑term Support | Bearish correction target |
⚙️ Structural Signals
- Break of Structure: Multiple BOS points show weakening bullish continuation.
- Change of Character: Fractal CHoCH near the highs signals early bearish intent.
- Internal Trading Range: Consolidation between 154.98–156.81 reflects indecision before potential breakdown.
- Fractal Zone: Clustered liquidity and volume exhaustion — a classic precursor to reversal.
📊 Forecast Scenario
If sellers defend the fractal zone effectively:
- Expect short‑term rejection below 164.00.
- A confirmed break under 154.98 could trigger momentum toward 140.00.
- Volume divergence supports the thesis — institutional activity appears to be rotating out of long exposure.
💬 Analyst Insight
This setup mirrors the liquidity sweep and reversal model often seen at macro tops. The Short Sell Monthly TF (1.8B) annotation implies institutional positioning for a medium‑term bearish swing. Macro drivers such as U.S. yields and BoJ policy tone remain critical catalysts.
🧠 Strategic Takeaway
- Bias: Bearish below 156.00
- Target: 140.00
- Invalidation: Sustained close above 165.00
- Risk Management: Tight stops above fractal highs; scale in on structure confirmation.
🏁 Summary
USD/JPY’s rally appears stretched, with fractal resistance and internal range compression hinting at a major corrective phase. A decisive bearish break could realign the pair toward long‑term equilibrium near 140.00 — consistent with historical liquidity cycles.
Disclaimer:
The information provided in this commentary is for educational and informational purposes only.
It does not constitute investment advice, financial recommendations, or solicitation to trade.
Trading and investing in financial markets involve significant risk, including the potential loss of capital.
The author is not licensed by the Hong Kong Securities and Futures Commission (SFC) under the Securities and Futures Ordinance (Cap. 571).
To carry out regulated activities such as dealing in securities (Type 1), advising on securities (Type 4), or asset management (Type 9). As such, this content must not be construed as regulated financial advice or services under Hong Kong law.
By accessing this content, you acknowledge and agree that the author assumes no responsibility or liability for any losses, damages, or outcomes arising from reliance on the information presented.
Viewers are strongly encouraged to conduct independent research and seek guidance from licensed financial professionals before making any investment or trading decisions.
This commentary is prepared in Hong Kong and is not intended to solicit or promote trading activity in jurisdictions where such actions may be restricted or unlawful.
Happy Trading,
Fxdollarsanalysis.com.
Leave a Reply